Manu Gupta, VP, Business Innovations
Today, data is the backbone of all business decisions. Deriving meaningful information and insights from varied data sets help a business take actions based on concrete know-how about their customers.
In a digital world, our customers are everywhere and so is the data trail. With this overly scattered data, it becomes difficult for marketers to draw accurate conclusions and build impactful strategies. This is where Data Stitching comes into the picture.
Data stitching is the process of bringing data from different platforms, devices, and sources to a commonplace. The e-commerce data thus can be consolidated into a uniform template for easy consumption and analysis.
EasyInsights, ET Medialabs’ unique in-house offering, helps us stitch data together on a real-time basis using API integration of various sources such as Google, Facebook, Appsflyer, Singular, Branch, LinkedIn, Snapchat, and many more. And that’s not all, EasyInsights also helps us connect CRM data through various webhooks.
Data breakdown and further analysis:
To break it down further – EasyInsights as a tool helps us to integrate each and every account of a particular client under one roof by creating a unique workstation dedicated to the client. Through this workstation, we are able to hit the APIs of various different platforms and fetch real-time data pertaining to the metrics available on the panels. Not only this, but EasyInsights also allows us to create custom labels for further breakdown and provide aggregate and segment-wise analysis of the data. This breakdown helps us do a more in-depth analysis at Platform, Placement, Audience, or even Creative levels.
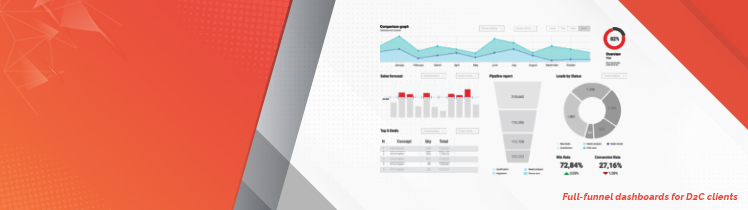
Once we have all the required mapping and labeling in place, we proceed towards Full-funnel stitching, i.e., fetching x data from Platform A, y data from Platform B, z data from Platform C, and stitching it all together to present it in one single sheet. This consolidated data is referred to as a ‘data view’ and can then be exported to any BI tool such as Tableau, Google Data Studio, etc to convert it into a more customizable informative report and dashboard. Reports don’t mean much if they’re not readable. Visuals make it easier to showcase our important KPIs, but with manual data reporting, this can be extremely time-consuming.
Benefits of using Automated Dashboards :
Such dashboards help in mitigating the manual effort that usually goes into daily data reporting as the data reporting gets wholly automated and is updated regularly on the set frequency. This ‘update frequency’ can be set on an hourly, daily, or even weekly basis. The API will continually refresh our metrics and dimensions. All we have to do is change the date range and pull the new report.
Automating the data reporting also helps diminish the scope of human error that is usually part and parcel of manual reporting. These dashboards make data reporting interactive, engaging, and visually appealing. They are connected to the data view created on EasyInsights and can virtually pull any data from any date range. And all this can be done on a real-time basis, meaning that we get the most up-to-date data possible.
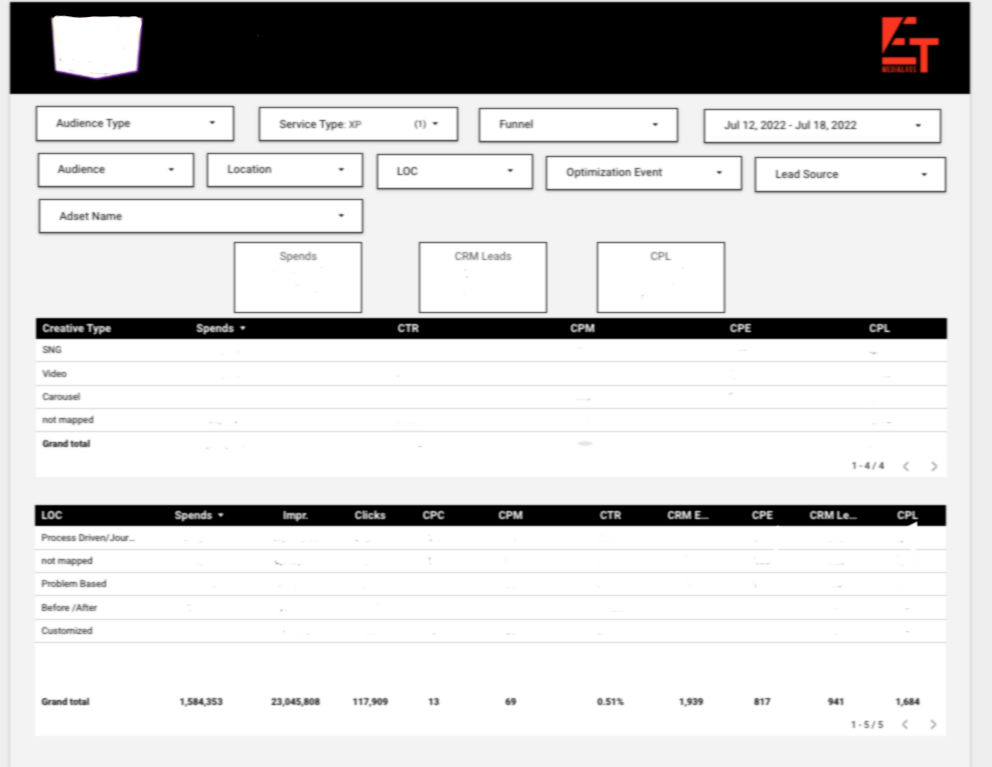
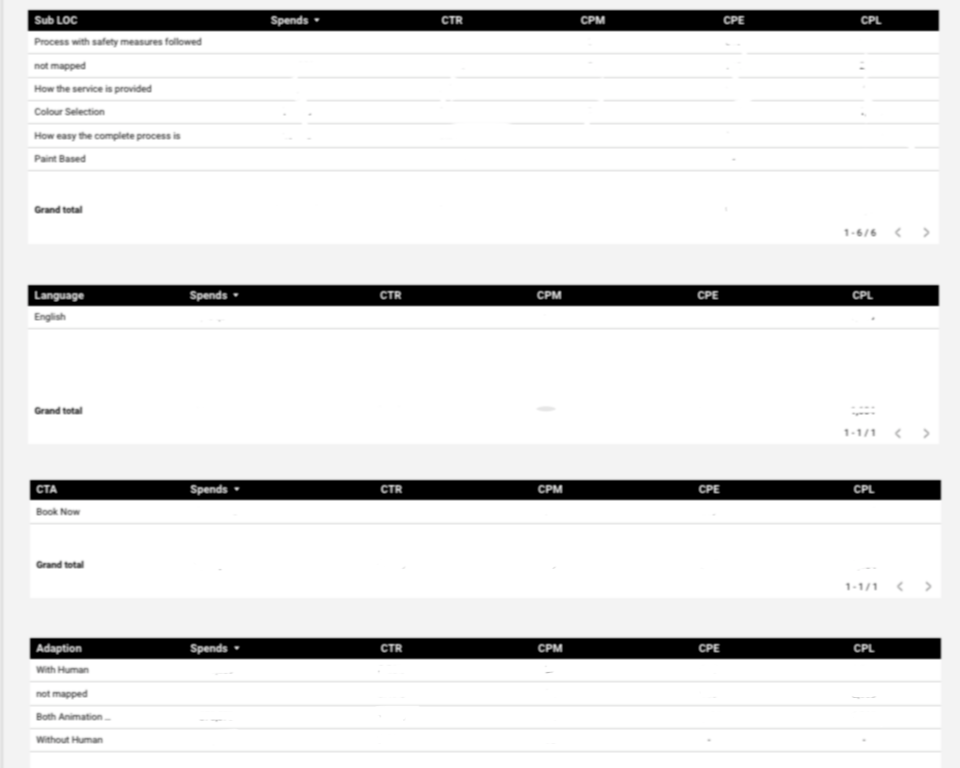
The dashboard also offers a full ad/creative-level breakdown – with respect to the Creative Type, LOC, Language, CTA, Dimensions, Video Length, and so on. These unique creative-custom dimensions, which are set manually, help us dive deep into the ad and differentiate between multiple ads or creatives basis their different and unique specs. This full-funnel in-depth analysis helps us get a 360° view of our campaign helps us drive our campaigns in the most effective manner.